Billing Attorney dashboard
The Billing Attorney dashboard helps attorneys view billing statistics for all matters that they are responsible for managing the book of business. Billing attorneys can use this dashboard to:
-
Track the billing rate realization for the matters they are responsible for billing.
-
View the collection budget and realization rate for the matters they were the billing attorney for.
-
Monitor the total posted accounts receivable (AR) for their billing attorney matters and at risk AR trends.
-
See how much work on matters has not been billed to clients and an aging comparison.
-
Track their monthly and yearly billing trends.
-
View lists of the top new clients they have billed the most time to and aged AR with the highest unpaid balances.
The following widgets are included on this dashboard.
Note: Many widgets can show month-to-date (MTD) or year-to-date (YTD) metrics. To switch between monthly and yearly metrics, select the appropriate to-date option at the top of the dashboard. The widgets that show only monthly and yearly metrics refresh and the selected to-date option appears as green text.
 Billing Realization
Use this widget to see the percentage of how much of your time was billed to clients compared to the amount written off in billing.
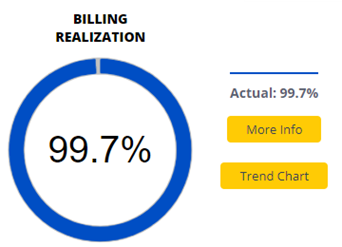
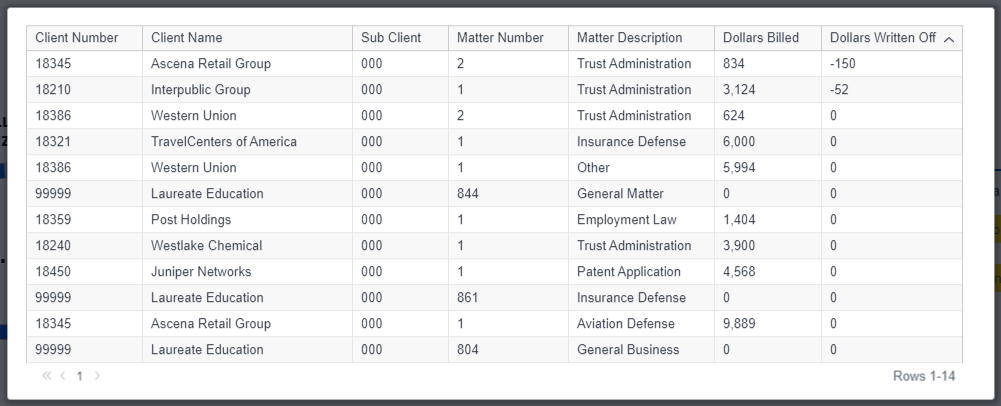
Select More Info to view a list of your billing realization by client/matter. This list includes the client number and name, sub client number, matter number and description, and dollars billed and written off for each matter.
-
By default, the list is sorted by dollars written off in ascending order. To change the sorting, hover over a column heading and then select the up arrow
 to sort in ascending order or select the down arrow
  to sort in descending order.
 -
Information for 25 matters is shown at a time. To view more rows, if available, use the paging options below the list. Select
 to go to the next row or select
  to go to the previous row. Select
  to go to the first rows in the list. Select a number to go to that grouping of rows.
 -
To close the list, select anywhere outside it.
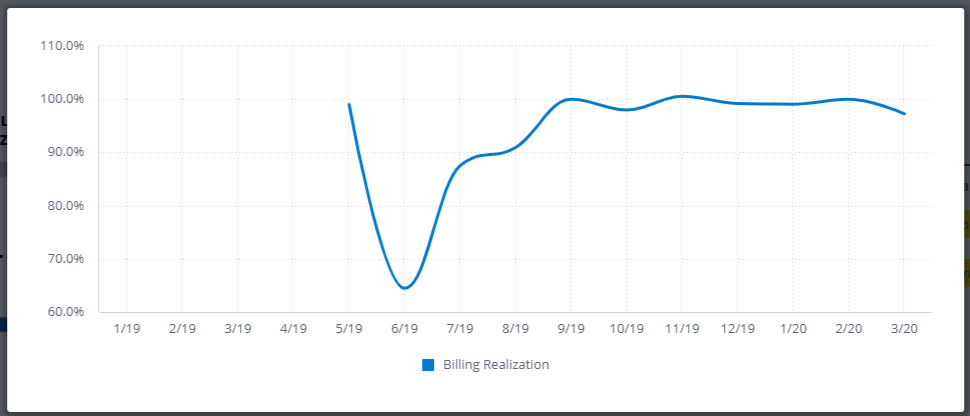
Select Trend Chart to view your billing realization trend. This chart shows realizations for each month of the current and previous fiscal year, when viewing MTD data, or for the past three years, when viewing YTD data.
-
Hover over a point on the chart to the see the realization for that month or year.
-
To close the chart, select anywhere outside it.
Collection Budget
Use this widget to see your percentage of cash receipts collected for the matters you were the billing attorney for compared to your goal. The displayed Target is either a weighted average of your collection totals over the past 36 months or your firm's collection budget, if a budget has been configured by your system admin. The Actual amount is how much cash you have collected for your billing attorney matters.
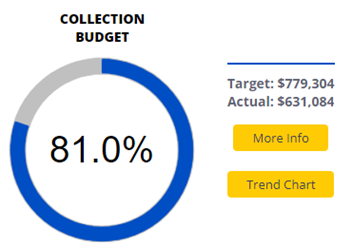
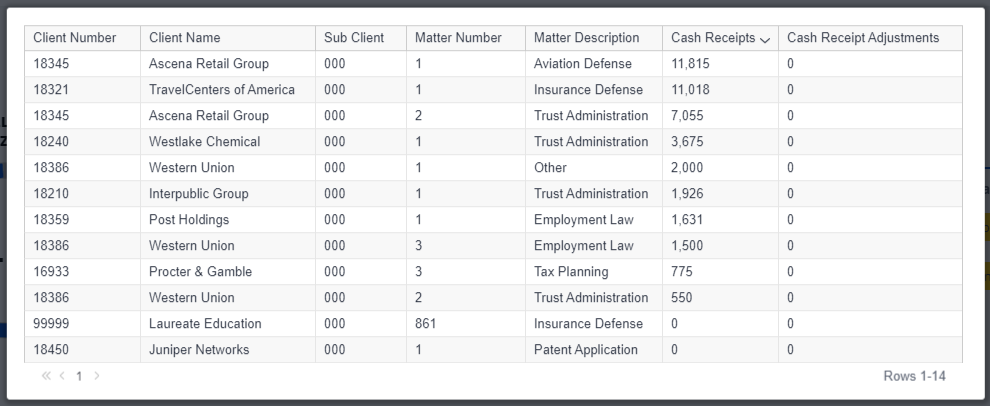
Select More Info to view a list of your collections by client/matter. This list includes the client number and name, sub client number, matter number and description, and cash receipts and adjustments for each matter.
-
By default, the list is sorted by cash receipts in descending order. To change the sorting, hover over a column heading and then select the up arrow
to sort in ascending order or select the down arrow to sort in descending order. -
Information for 25 matters is shown at a time. To view more rows, if available, use the paging options below the list. Select
to go to the next row or select to go to the previous row. Select to go to the first rows in the list. Select a number to go to that grouping of rows. -
To close the list, select anywhere outside it.
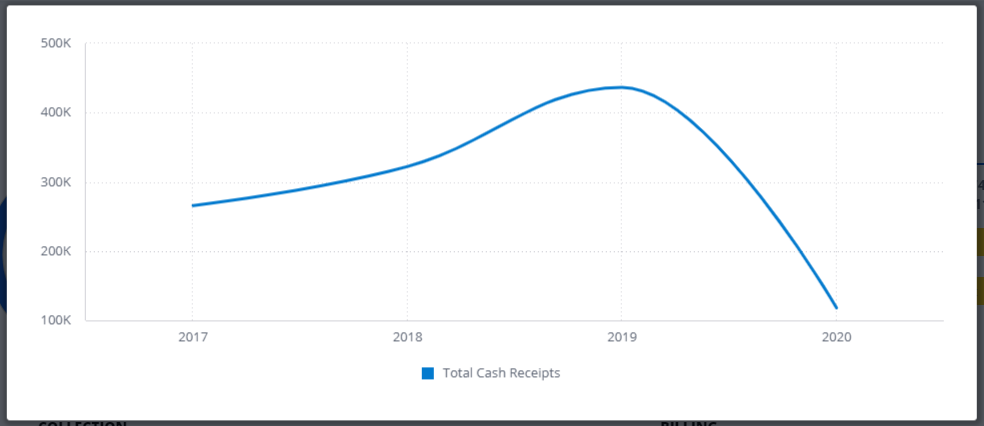
Select Trend Chart to view your collections trend. This chart shows totals for each month of the current and previous fiscal year, when viewing MTD data, or for the past three years, when viewing YTD data.
-
Hover over a point on the chart to the see the total for that month or year.
-
To close the chart, select anywhere outside it.
Collection Realization
Use this widget to see the percentage of how much of your time was collected from clients compared to the amount of time that was written off in AR.
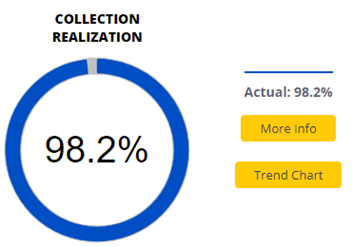
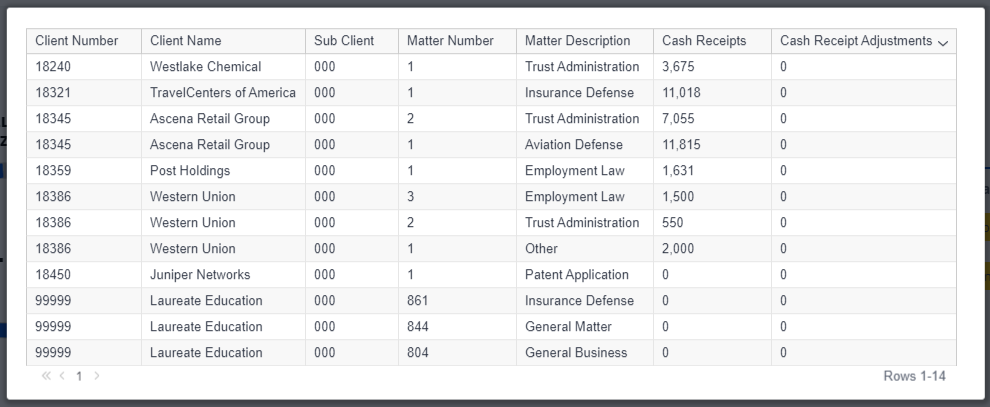
Select More Info to view a list of your collection realization by client/matter. This chart shows realizations for each month of the current and previous fiscal year, when viewing MTD data, or for the past three years, when viewing YTD data.
-
By default, the list is sorted by cash rate adjustments in ascending order. To change the sorting, hover over a column heading and then select the up arrow
to sort in ascending order or select the down arrow to sort in descending order. -
Information for 25 matters is shown at a time. To view more rows, if available, use the paging options below the list. Select
to go to the next row or select to go to the previous row. Select to go to the first rows in the list. Select a number to go to that grouping of rows. -
To close the list, select anywhere outside it.
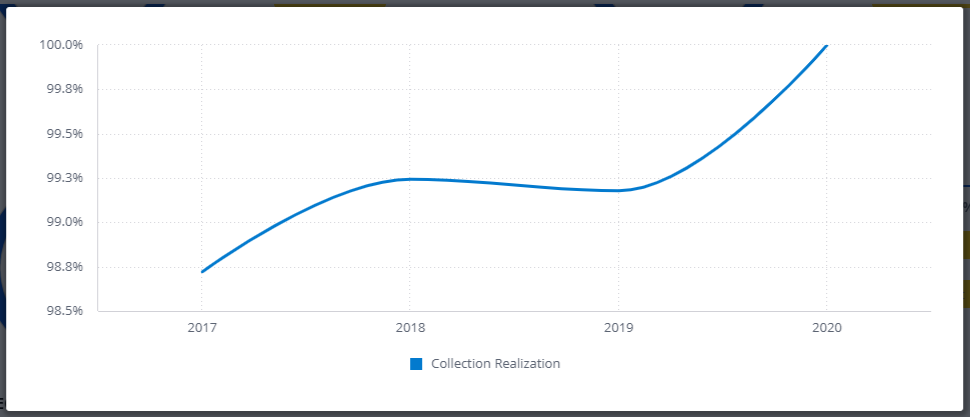
Select Trend Chart to view your collection realization trend. This chart shows realizations for each month of the current and previous fiscal year, when viewing MTD data, or for the past three years, when viewing YTD data.
-
Hover over a point on the chart to the see the realization for that month or year.
-
To close the chart, select anywhere outside it.
Accounts Receivable Trend
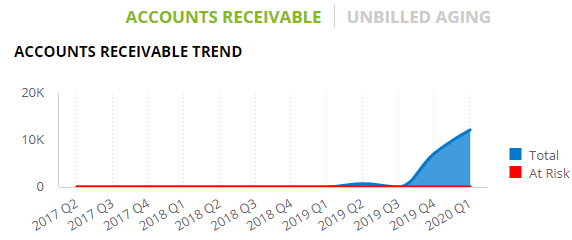
Use this widget to see your average AR balance for the matters you were the billing attorney for per quarter and identify trends in how much of your work was posted to invoices over this year and the past three years. The Total amounts are all your work as the billing attorney that moved to AR. The At Risk amounts are your balances that remained in AR for your oldest aging period.
-
Hover over a point on the chart to see the AR balance for that quarter.
-
Hover over an option in the legend to highlight the corresponding data on the chart. Select an option in the legend to remove the data from the chart. Select the option again to add the data back to the chart.
Unbilled Aging Trend
Use this widget to see the total amount of work in dollars that has not been billed to clients for the matters you were the billing attorney for and an aging comparison of the number days that work remains unbilled. Aging time ranges show the work that remained unbilled for 0-30 days, 31-60 days, 61-90 days, 91-120 days, and over 120 days.
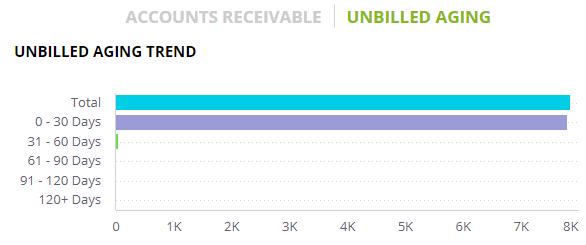
Hover over a bar on the chart to see the unbilled work amount in dollars for that aging range.
Billing Trend
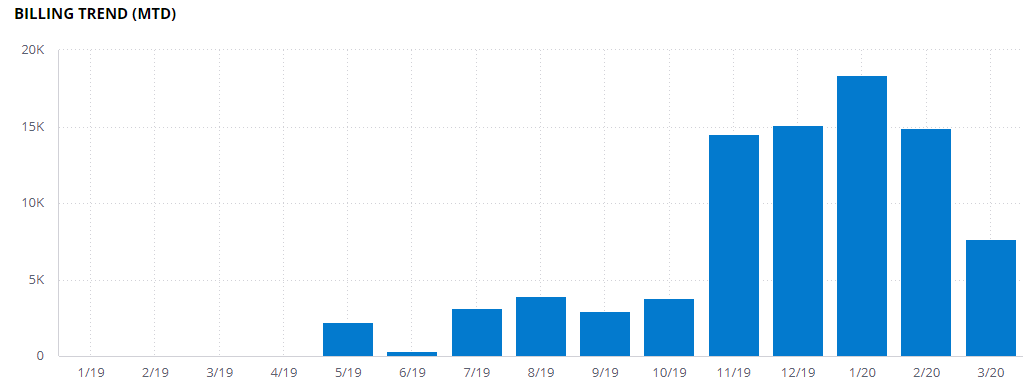
Use this widget to see trends in the amount of billed dollars for the matters you were the billing attorney for.
-
Select By Month to see billing totals for each month of the current and previous fiscal year. Select By Year to see billing totals for the past three years.
-
Hover over a column on the chart to see the billed dollars total for that month or year.
Top New Clients
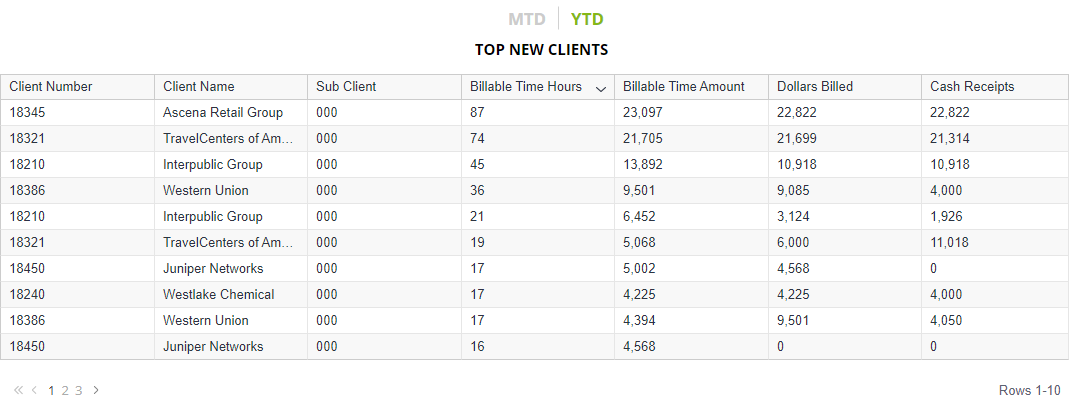
Use this widget to see a list of your top new clients from the past 12 months who you were responsible for billing. The list includes client numbers and names with billable hours, billable dollars, dollars billed, and cash receipts totals. By default, the list is sorted by billable hours in descending order to show the new clients you have worked the most billable time for.
-
To change the sorting, hover over a column heading and then select the up arrow
to sort in ascending order or select the down arrow to sort in descending order. -
To switch the time period to view information for, select a to-date option above the widget. MTD shows month-to-date information and YTD shows year-to-date information.
-
To view more rows, if available, use the paging options below the list. Select
to go to the next row or select to go to the previous row. Select to go to the first rows in the list. Select a number to go to that grouping of rows.
Top Aged Accounts Receivable
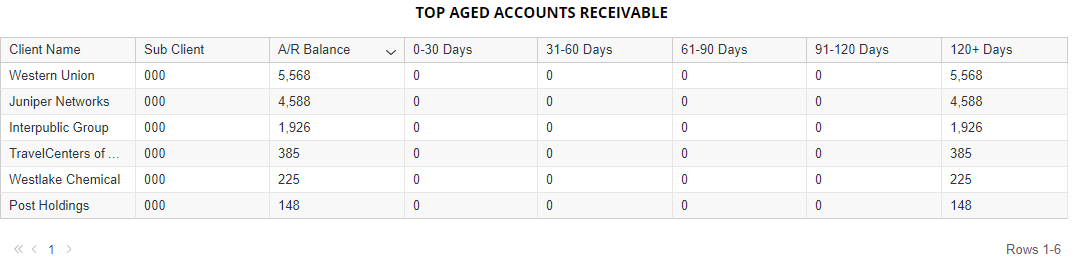
Use this widget to see a list of your clients with the highest AR balances and how much invoiced work remains in AR and for how long. The list includes client names with total AR balances and the AR amounts that have aged 0-30 days, 31-60 days, 61-90 days, 91-120 days, and over 120 days. By default, the list is sorted by AR balance in descending order to show the clients with the highest unpaid balances.
-
To change the sorting, hover over a column heading and then select the up arrow
to sort in ascending order or select the down arrow to sort in descending order. -
Information for 10 clients is shown at a time. To view more rows, if available, use the paging options below the list. Select
to go to the next row or select to go to the previous row. Select to go to the first rows in the list. Select a number to go to that grouping of rows.
Note: The main menu is not visible when viewing a SurePoint View dashboard. When you finish viewing a dashboard, click the SurePoint logo in the upper-left corner of the screen to return to the Home screen.
